1
Derivatives Rollover Report | February 25, 2021
For Private Circulation Only
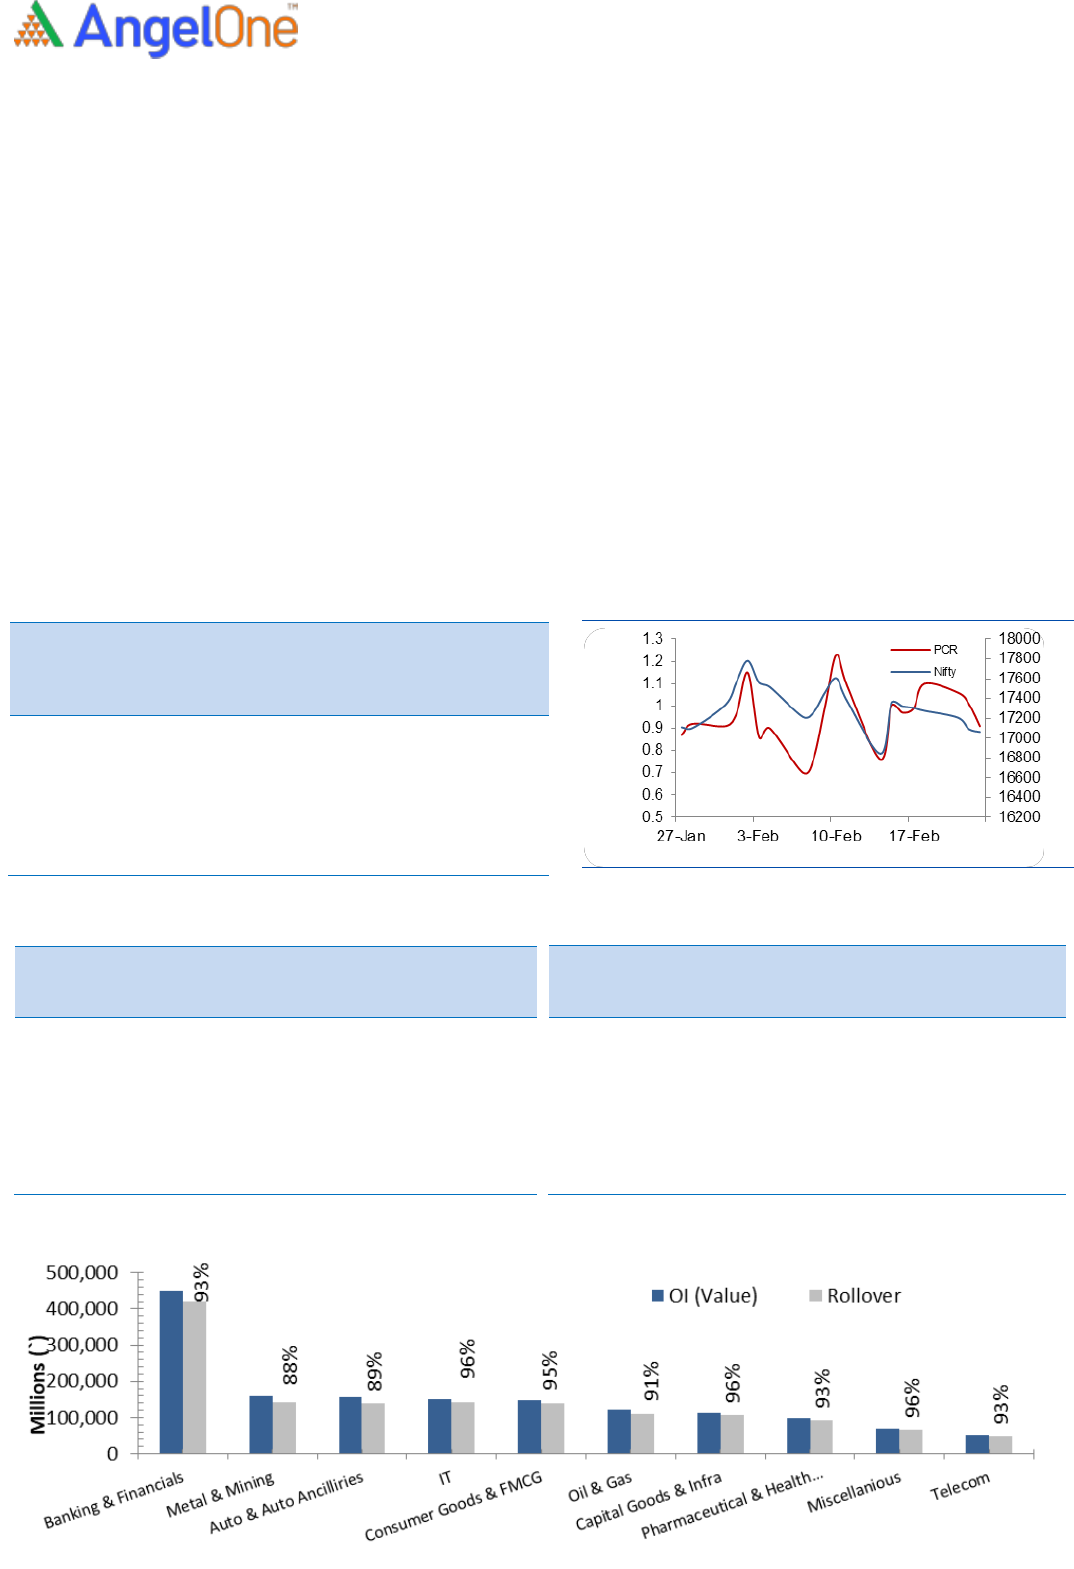
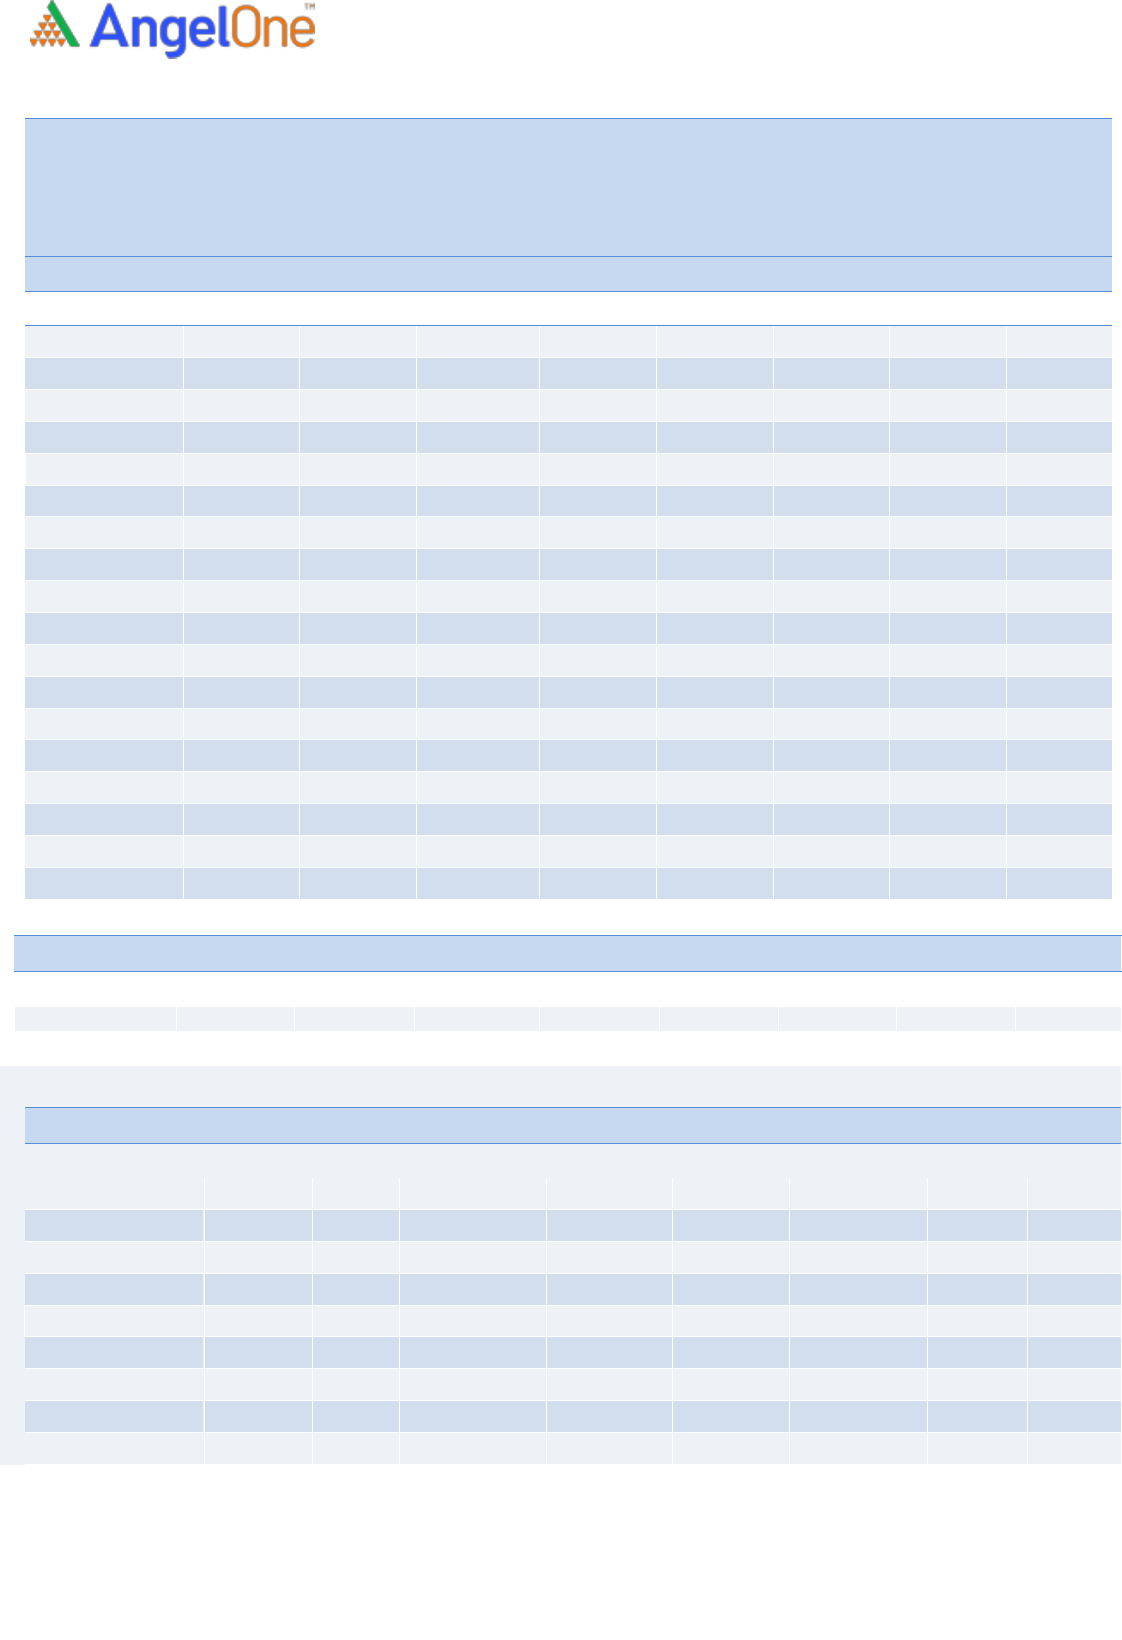
NIFTY & PCR Graph
Monthly Gainers
Scrip
Price
Price
Change
(%)
Open
Interest
Ol
Change
(%)
GNFC
509.75
8.75
2834000
(14.11)
LAURUSLABS
502.60
8.16
5522400
6.27
HINDALCO
517.70
5.56
34406450
(0.91)
NATIONALU
M
112.00
5.36
89471000
(22.46)
INDIAMART
4346.00
(4.98)
323625
12.52
Note: Stocks which have more than 1000 contract in Futures OI.
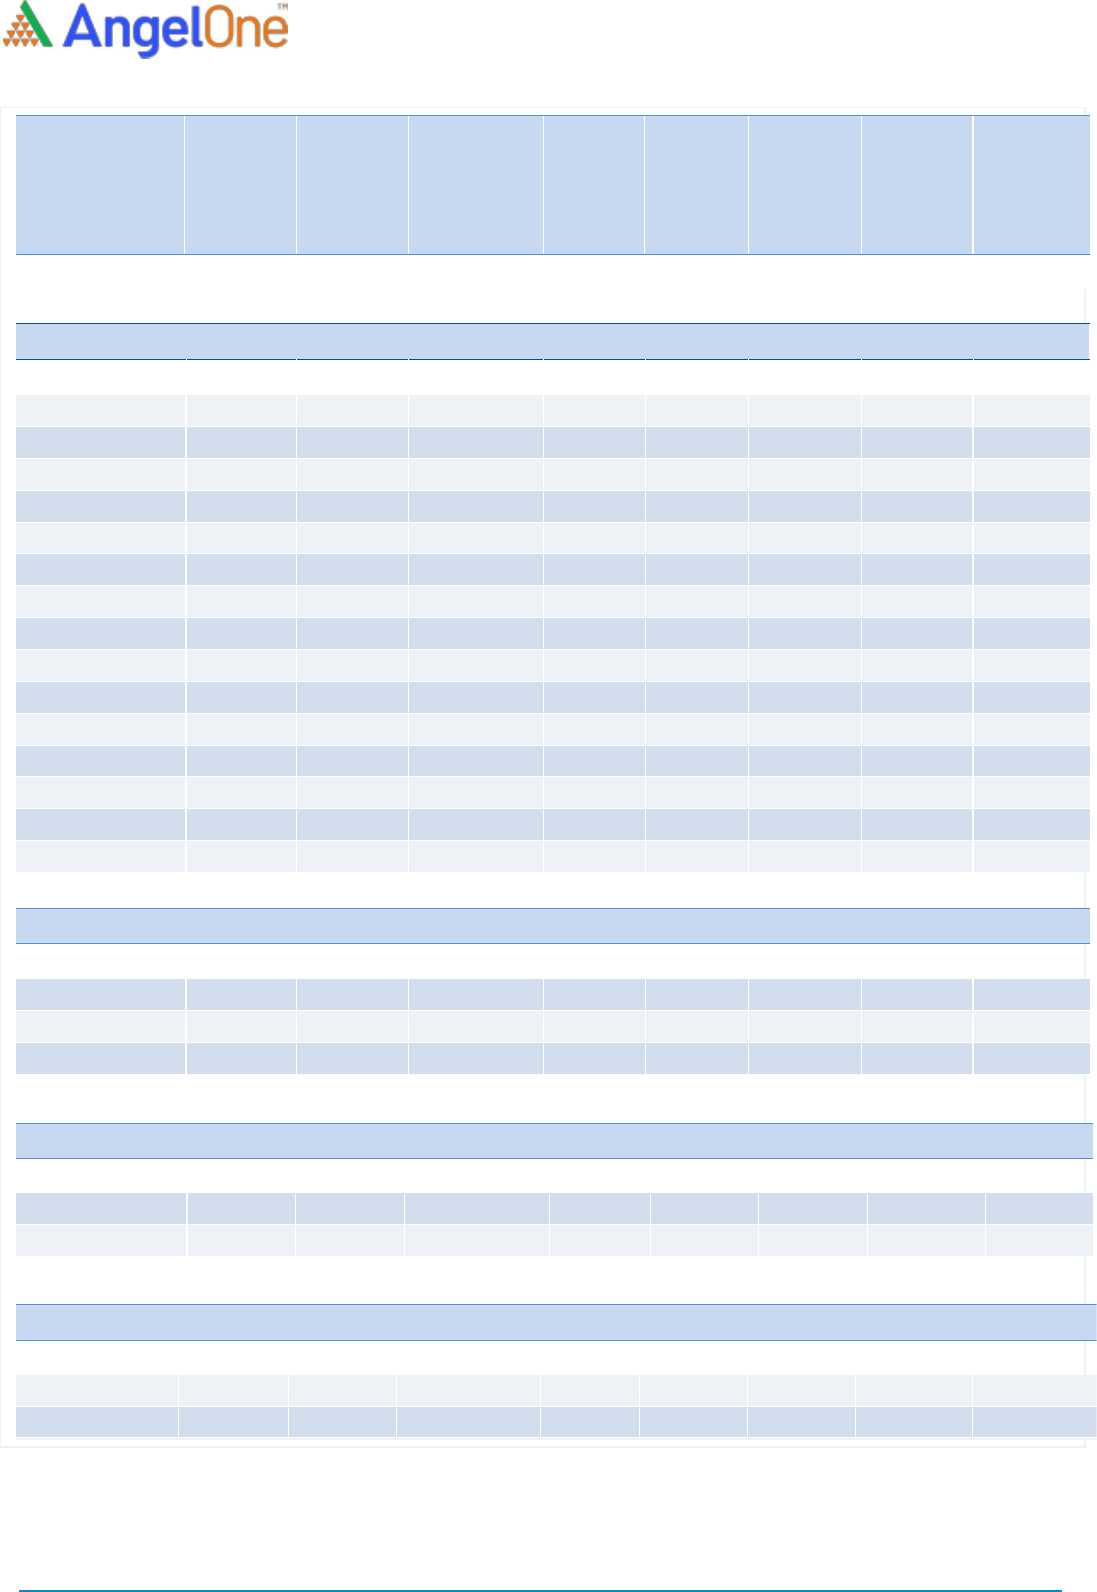
Monthly Losers
Scrip
Price
Price
Change
(%)
Open
Interest
Ol
Change
(%)
IBULHSGFIN
148.75
(28.91)
28222400
(18.56)
MANAPPURA
M
109.90
(28.29)
25548000
7.35
BHEL
44.35
(25.84)
105714000
(12.80)
NBCC
34.35
(25.08)
24060000
(36.61)
MCX
1181.90
(23.90)
1974000
(2.25)
Note: Stocks which have more than 1000 contract in Futures OI.
It was indeed an action packed month for the Indian equity market as we had an important event of Union Budget in the
first week and then the geo-political tension with respect to Russia and Ukraine in the final week of February series. We
witnessed benchmark index inching towards 17800 in the start and then attracted selling to almost test the 16800 mark.
This was followed by some respite to reclaim 17500 but due to global nervousness once again the selling reoccurred to not
only test 16800 but even to slide towards 16200 on the monthly expiry day as Russia finally invaded its neighbouring
country which had a complete outburst of fear across the global financial markets. We concluded the series with full of
roller coaster moves at the lowest point in last seven months.
Now let’s take a quick glance at the F&O activities. During the series, we saw mixed bets but majority was on the short side.
Rollover for Nifty and BankNifty stood at 77% and 76% respectively, which is certainly below the three month average. This
clearly indicates traders preferring staying light seeing the nervousness around the globe. Stronger hands continued their
selling streak in equities but added bullish bets in index and stock futures segment. Considering the above data points, we
would advocate staying light on positions. As far as levels are concerned, 16000-16200 is the immediate demand zone;
whereas, resistance is placed around 16800 followed by 17000 now.
Indices Change
INDEX
Price
Price
Change
(%)
Rollover
3 month
avg.
NIFTY
16247.95
(5.11)
77.22
78.35
BANKNIFTY
35228.10
(7.66)
76.23
81.94
FINNIFTY
16531.55
(8.49)
-
-
-
-
-
-
-
-
-
-
-
-
Derivatives Rollover Report
For Private Circulation Only
2
Scrip
Price
Price
Change
(%)
OI
Futures
OI
Change
(%)
COC (%)
PCR-OI
Rollover
(%)
Average
Rollover
(3month)
(%)
AUTO & AUTO ANCILLARIES
AMARAJABAT
525.05
(12.50)
7860000
(28.00)
2.69
0.63
89.86
93.94
APOLLOTYRE
179.05
(15.60)
11017500
(4.55)
3.21
0.59
91.76
94.00
ASHOKLEY
113.90
(13.15)
34227000
6.93
2.29
0.57
91.00
92.38
BAJAJ-AUTO
3476.75
(0.86)
2013000
(27.90)
-0.60
0.57
96.44
96.35
BALKRISIND
1763.80
(22.01)
1453600
28.64
3.59
0.58
96.16
96.46
BHARATFORG
661.80
(8.45)
5460750
(15.50)
-9.06
0.51
96.42
97.49
BOSCHLTD
14857.65
(8.54)
120200
(20.16)
-11.09
0.64
96.28
96.58
EICHERMOT
2616.35
(1.47)
2797900
9.46
-0.28
0.74
95.74
97.35
ESCORTS
1782.70
(4.14)
4595800
(29.75)
-7.26
0.93
52.48
74.79
EXIDEIND
141.30
(17.99)
24105600
1.45
-0.74
0.69
92.72
91.91
HEROMOTOCO
2492.35
(6.31)
3201600
(14.33)
0.84
0.55
94.54
95.13
M&M
797.25
(7.26)
14083300
17.74
1.90
0.33
95.86
90.83
MARUTI
8224.30
(6.04)
2476900
(2.78)
1.80
0.51
91.40
93.93
MOTHERSUMI
144.70
(17.10)
22270500
(20.32)
1.08
0.67
92.65
95.56
MRF
63038.95
(10.90)
65450
13.59
-14.82
0.55
98.01
98.09
TATAMOTORS
427.55
(13.96)
71232900
(15.23)
-0.97
0.63
92.86
92.91
TVSMOTOR
617.90
(2.19)
7130200
(4.57)
-2.02
0.49
87.54
90.90
BANKING & FINANCIALS
AUBANK
1165.65
(8.84)
2479500
(16.89)
-12.29
0.65
93.76
95.87
AXISBANK
732.30
(5.50)
38383200
(23.44)
2.86
0.70
92.57
95.40
BAJAJFINSV
15277.25
(0.83)
637250
(7.47)
2.19
0.70
92.69
93.33
BAJFINANCE
6634.20
(3.46)
4123125
(11.38)
1.02
0.78
95.27
96.45
BANDHANBNK
291.40
(10.05)
21515400
(27.53)
0.72
0.66
92.53
93.46
BANKBARODA
100.85
(2.75)
98993700
(29.77)
3.63
0.72
94.14
94.37
CANBK
208.55
(13.64)
41509800
(19.86)
1.25
0.63
93.25
95.85
CHOLAFIN
648.60
(0.95)
8372500
2.15
1.21
0.54
95.80
97.02
CUB
122.65
(14.77)
10975200
(20.14)
-1.27
0.68
95.11
95.38
FEDERALBNK
93.60
(6.68)
61070000
(40.77)
-2.78
0.52
93.14
93.76
HDFC
2348.50
(6.69)
22439700
55.98
2.45
0.85
96.23
96.84
HDFCAMC
2017.40
(5.91)
2847800
(10.64)
-1.91
0.85
97.73
97.49
HDFCBANK
1422.70
(3.95)
26700850
(24.46)
2.42
0.67
95.22
95.86
IBULHSGFIN
148.75
(28.91)
28222400
(18.56)
2.11
0.66
85.03
72.70
ICICIBANK
708.10
(11.35)
97784500
25.85
1.03
0.70
95.56
92.90
ICICIPRULI
467.95
(14.33)
7344750
35.62
1.79
0.58
96.37
95.67
IDFCFIRSTB
38.70
(16.32)
145465500
(21.51)
-5.36
0.64
92.63
95.36
INDUSINDBK
876.70
(1.79)
24858000
(21.07)
1.25
0.59
97.01
96.09
KOTAKBANK
1787.15
(5.71)
13082800
(2.89)
-4.47
0.71
95.47
94.95
Derivatives Rollover Report
For Private Circulation Only
3
Scrip
Price
Price
Change
(%)
OI Futures
OI
Change
(%)
COC (%)
PCR-OI
Rollover
(%)
Average
Rollover
(3month)
(%)
L&TFH
62.30
(14.42)
65662792
(19.68)
0.00
0.76
93.35
95.53
LICHSGFIN
331.00
(4.75)
20498000
(9.96)
2.84
0.50
92.65
93.31
M&MFIN
139.90
(10.61)
30516000
0.04
-6.30
0.60
94.69
93.30
MANAPPURAM
109.90
(28.29)
25548000
7.35
-1.89
0.46
90.81
93.23
MFSL
803.25
(9.92)
1418950
(29.17)
-8.37
1.00
97.67
97.66
MUTHOOTFIN
1303.60
(9.43)
2724375
(34.18)
-9.08
0.82
73.79
90.34
NAM-INDIA
298.90
(7.72)
2419200
(34.57)
-38.47
0.58
96.80
95.96
PFC
105.45
(11.54)
41471800
0.74
-57.03
0.71
85.35
90.51
PNB
32.25
(22.01)
119216000
(59.79)
8.15
0.79
59.59
84.06
RBLBANK
122.75
(20.19)
38198800
7.67
3.84
0.91
90.00
86.79
RECLTD
117.00
(12.85)
30408000
(25.14)
0.00
0.85
82.10
90.01
SBIN
471.80
(11.05)
71536500
(20.64)
-1.88
0.73
89.61
93.42
SRTRANSFIN
1066.40
(14.26)
3574400
(3.04)
-2.10
0.45
95.59
93.01
CAPITAL GOODS & INFRASTRUCTURE
ADANIPORTS
656.80
(7.50)
86385000
(5.48)
3.11
0.71
97.79
98.57
BHEL
44.35
(25.84)
105714000
(12.80)
0.00
0.63
94.92
96.17
GMRINFRA
34.60
(14.04)
84892500
(8.36)
3.02
0.65
90.74
94.73
HAVELLS
1148.35
(0.14)
3909500
(9.24)
0.86
0.61
97.60
92.23
LT
1759.65
(8.28)
12697725
(9.49)
1.36
0.84
92.99
87.90
SIEMENS
2291.00
0.40
1360425
(21.89)
2.37
0.41
96.73
89.89
VOLTAS
1172.30
0.61
3689000
(13.78)
-21.43
0.45
94.28
95.72
CEMENT
ACC
2019.70
(7.31)
2174250
(30.46)
2.95
0.78
97.34
95.71
AMBUJACEM
301.10
(14.51)
19390500
20.93
-19.88
0.32
95.77
95.44
GRASIM
1549.35
(8.72)
9964075
(2.22)
3.38
0.89
96.54
97.78
RAMCOCEM
765.65
(9.34)
1383800
(31.16)
-4.88
1.26
94.43
97.39
SHREECEM
23086.25
(3.67)
182700
(12.52)
-2.83
0.50
98.49
98.88
ULTRACEMCO
6728.40
4.54
1574200
5.44
9.68
0.43
96.14
96.10
CHEMICALS & FERTILIZERS
Derivatives Rollover Report
For Private Circulation Only
4
Scrip
Price
Price
Change
(%)
OI Futures
OI
Change
(%)
COC (%)
PCR-OI
Rollover
(%)
Average
Rollover
(3month)
(%)
Consumer Goods & FMCG
ASIANPAINT
3073.10
(1.64)
4352550
11.30
1.41
0.76
96.09
95.11
BERGEPAINT
679.95
(5.11)
4413200
(12.48)
0.69
0.57
96.67
97.34
BERGEPAINT
BRITANNIA
3444.30
(1.60)
1432600
19.84
-0.48
0.81
97.05
95.36
BRITANNIA
COLPAL
1382.35
(1.11)
1930600
(36.02)
-11.12
0.93
83.21
92.97
COLPAL
DABUR
534.20
0.53
13386250
23.46
0.98
0.83
98.14
97.32
DABUR
GODREJCP
772.95
(12.37)
5954500
26.68
2.43
0.81
96.13
96.29
GODREJCP
HINDUNILVR
2177.45
(5.36)
9917100
(1.25)
2.91
0.77
96.07
96.14
HINDUNILVR
ITC
208.20
(1.30)
170870400
(25.39)
-1.50
0.86
92.78
94.29
ITC
JUBLFOOD
2884.95
(11.27)
2377250
14.66
0.14
0.54
91.16
94.61
JUBLFOOD
MARICO
484.85
5.28
8722000
(8.40)
3.13
0.45
97.64
91.60
MARICO
MCDOWELL-N
843.75
(0.11)
14942500
(11.71)
-0.99
0.58
97.75
98.08
MCDOWELL-N
NESTLEIND
17761.55
(3.72)
321050
3.46
1.01
0.78
96.35
96.31
NESTLEIN
D
TATACONSUM
679.90
(3.81)
11242800
(2.36)
3.39
0.38
95.51
96.75
TATACON
SUM
TITAN
2409.20
3.81
5759250
1.85
1.13
0.49
92.59
95.83
TITAN
UBL
1453.55
(2.93)
829500
(10.30)
-7.87
0.37
83.19
73.63
UBL
COALINDIA
293.80
1.71
14714400
2
9
.
8
0
8.26
0.35
63.04
65.79
HINDALCO
88.10
30.23
34330000
(
1
3
.
3
6
)
2.22
0.61
78.46
82.59
HINDZINC
1
0
8
.
5
9
METALS & MINING
COALINDIA
149.65
(6.82)
35347200
(23.25)
-2.43
0.50
79.03
88.21
HINDALCO
517.70
5.56
34406450
(0.91)
0.10
0.43
81.79
84.78
JINDALSTEL
370.45
(1.54)
28972500
(14.91)
1.83
0.60
96.13
97.62
JSWSTEEL
571.40
(8.95)
38272500
(8.49)
3.75
0.71
97.73
98.36
NATIONALUM
112.00
5.36
89471000
(22.46)
-0.47
0.50
95.41
96.93
NMDC
134.50
0.00
73639700
(19.71)
0.39
0.77
80.69
90.21
SAIL
84.85
(11.66)
150641500
(15.77)
-1.84
0.73
92.08
95.89
TATASTEEL
1075.80
(1.64)
42457925
(3.26)
1.70
0.76
97.73
97.75
VEDL
330.70
0.33
54101200
(17.52)
-22.67
0.60
66.17
81.73
TEXTILES
INFORMATION TECHNOLOGY
COFORGE
4185.05
(4.72)
493100
(24.01)
-10.09
0.46
73.67
77.32
HCLTECH
1101.65
1.70
20016500
(29.62)
2.94
0.68
95.23
87.08
INFY
1679.80
(0.25)
39786600
5.79
1.06
0.60
98.30
91.95
LTI
5607.60
(2.83)
952050
(5.86)
1.23
0.85
89.98
83.49
MINDTREE
3577.80
(0.41)
2743800
(7.02)
3.47
0.76
97.71
97.05
MPHASIS
2955.45
0.42
1553825
(11.44)
1.31
0.49
98.56
96.11
NAUKRI
4282.15
(2.66)
1661500
(1.40)
0.44
0.64
89.29
94.10
TCS
3411.85
(6.98)
13408200
11.94
3.11
0.49
90.82
92.48
TECHM
1333.75
(8.18)
15935400
(1.44)
0.59
0.73
91.53
92.17
WIPRO
0.00
0.00
35552000
(15.29)
-3.01
0.70
94.46
90.49
TELECOM
BHARTIARTL
350.55
0.39
34602594
(4.18)
7.10
0.90
89.38
87.82
IDEA
12.45
(7.43)
363300000
(10.52)
10.56
0.83
82.76
85.28
INFRATEL
276.95
1.58
6836000
3.14
10.20
0.49
84.58
83.89
TEXTILES
ARVIND
66.40
(15.36)
5862000
(11.53)
5.92
1.09
82.52
89.16
CENTURYTEX
959.75
(7.62)
3744000
5.98
-1.70
0.81
98.89
99.06
PAGEIND
20491.75
6.10
156325
9.82
-9.51
0
96.19
89.39
RAYMOND
739.95
(13.35)
2732800
4.75
7.00
1.38
97.21
96.63
Derivatives Rollover Report
For Private Circulation Only
5
Scrip
Price
Price
Change
(%)
OI
Futures
OI
Change
(%)
COC (%)
PCR-OI
Rollover
(%)
Average
Rollover
(3month
)
(%)
INFORMATION TECHNOLOGY
HCLTECH
564.00
(0.70)
22885800
(1.26)
8.14
0.58
98.56
96.78
INFY
730.55
3.77
24351600
(52.50)
2.86
0.74
55.98
79.52
MINDTREE
782.95
10.93
1041600
(14.29)
-15.63
0.59
93.13
93.37
NIITTECH
1606.65
6.68
578250
26.08
-2.03
0.46
89.76
82.99
TCS
2212.80
6.19
15671500
(17.22)
6.42
1.91
95.02
94.74
TECHM
775.75
1.00
15406800
8.21
9.05
0.65
96.29
97.15
WIPRO
249.90
3.65
18211200
(29.64)
-2.08
0.72
83.12
92.60
MISCELLANIOUS
ABFRL
250.75
(12.31)
12864800
6.68
-0.21
0.40
94.43
95.06
ADANIENT
1551.25
(8.40)
21242000
2.30
4.83
0.83
97.97
98.51
APOLLOHOSP
4386.00
1.66
2569125
(16.00)
0.96
0.51
97.88
96.35
ASTRAL
1784.85
(13.94)
1090375
2.53
0.96
0.57
97.11
95.73
BATAINDIA
1779.20
(9.09)
1277100
7.35
1.61
0.55
84.25
90.90
BEL
187.85
(7.80)
24293400
(26.25)
0.00
0.94
86.38
92.73
CONCOR
559.55
(9.19)
5468000
(3.38)
2.24
0.47
97.88
93.96
CUMMINSIND
928.15
2.72
1634400
8.10
0.56
0.44
90.26
88.52
HDFCLIFE
532.90
(14.57)
25646500
24.99
-0.10
0.65
94.37
93.89
ICICIGI
1238.75
(9.79)
2804150
(9.31)
-1.76
0.77
96.38
97.53
INDHOTEL
194.10
(3.46)
16136264
11.88
-1.07
0.50
90.50
92.45
INDIGO
1830.00
(2.20)
3197500
16.99
-0.37
0.57
93.53
96.31
IRCTC
737.65
(9.65)
9595250
(1.43)
-0.57
0.62
95.20
91.91
LALPATHLAB
2491.55
(8.83)
823250
(5.55)
-22.86
0.53
92.51
95.11
LTTS
4250.20
(2.99)
636200
(31.96)
-9.71
0.82
95.21
96.19
METROPOLIS
1990.00
(18.26)
625600
(11.91)
-4.20
0.46
86.70
85.21
SBILIFE
1055.50
(13.07)
7794750
5.50
1.29
0.48
95.97
92.44
TRENT
1021.30
(0.50)
2421500
(10.07)
0.66
0.68
97.38
83.22
MEDIA
PVR
1519.05
(1.66)
2281235
(27.10)
3.24
0.52
93.14
93.83
SUNTV
428.55
(9.73)
12096000
(1.45)
3.30
0.47
94.63
96.76
ZEEL
221.60
(21.94)
71310000
(7.94)
1.89
0.89
94.42
96.50
IGL
506.15
(1.77)
5178250
(23.81)
7.68
1.13
97.21
91.91
IOC
91.70
(9.79)
62803000
(12.25)
9.18
0.66
93.34
91.89
MGL
1142.20
(4.95)
1020000
(34.79)
1.01
0.96
95.18
90.39
ONGC
102.90
(13.13)
38269000
(13.29)
9.20
0.69
92.19
84.88
PETRONET
222.20
(14.51)
18006000
4.88
6.85
0.92
96.78
95.76
RELIANCE
2008.90
(6.90)
26297500
(1.73)
9.11
0.63
97.62
95.78
BPCL
470.70
11.69
44681400
8.98
8.89
0.51
93.84
91.32
BATAINDIA
1444.10
8.68
1488850
(10.54)
-2.88
0.42
93.06
94.61
BEL
115.85
1.49
22602000
(2.49)
10.21
0.44
97.34
96.42
MCX
659.60
(6.88)
2102100
(7.23)
11.16
0.79
93.26
90.88
MCX
1111.60
2.65
1348000
12.33
-3.27
0.66
92.87
80.54
OIL & GAS
BPCL
331.45
(12.11)
21826800
(27.34)
-5.01
0.82
83.03
92.27
GAIL
127.85
(9.45)
29780200
(20.44)
-15.27
0.65
78.91
87.74
GUJGASLTD
572.05
(17.18)
2291250
12.25
-1.18
0.82
93.47
95.07
HINDPETRO
269.75
(12.84)
8561700
(32.72)
-9.20
0.97
68.25
84.73
IGL
332.75
(15.63)
18114250
(7.05)
-4.84
0.65
93.00
94.80
IOC
108.70
(9.42)
32428500
(36.74)
-12.32
0.71
70.69
85.42
MGL
681.45
(15.10)
3763800
(24.77)
0.15
0.63
93.79
95.34
ONGC
156.50
(4.89)
31493000
(52.27)
-1.00
0.30
83.95
90.13
PETRONET
191.50
(9.78)
17916000
(8.63)
3.00
0.69
96.81
96.82
RELIANCE
2261.70
(3.65)
31145750
(8.25)
2.75
0.60
94.96
95.85
AUROPHARMA
1037.15
6.60
8765250
(5.00)
7.85
0.51
97.81
95.86
BIOCON
383.45
(3.23)
17434000
0.03
5.93
0.71
86.18
89.52
CADILAHC
629.55
11.44
22301400
43.30
6.29
0.51
95.72
93.45
CIPLA
946.80
3.82
10505950
(19.23)
6.89
0.53
91.10
89.74
Derivatives Rollover Report
For Private Circulation Only
6
Scrip
Price
Price
Change
(%)
OI Futures
OI
Change
(%)
COC
(%)
PCR-OI
Rollover
(%)
Average
Rollover
(3month)
(%)
PHARMACEUTICAL
ALKEM
3180.00
(5.65)
287800
18.44
2.76
0.76
95.81
82.46
APLLTD
703.50
(4.81)
1638700
(12.88)
1.56
0.86
92.31
90.53
AUROPHARMA
606.50
(0.25)
13899750
(17.90)
1.81
0.63
95.35
95.46
BIOCON
375.45
4.00
12061200
(34.34)
3.62
0.60
95.50
96.11
CADILAHC
344.25
(10.48)
19811000
(13.94)
-1.51
0.76
93.23
94.92
CIPLA
896.00
(2.95)
9653800
(16.71)
0.29
0.57
81.93
88.10
DIVISLAB
3947.60
(0.30)
2541300
(17.67)
2.87
0.60
97.13
96.63
DRREDDY
4087.80
(4.20)
2723125
(5.12)
-1.21
0.83
95.74
86.71
GLENMARK
430.80
(9.68)
7208200
(15.99)
2.43
0.90
96.28
97.00
GRANULES
268.20
(8.74)
11445200
(17.74)
3.51
0.48
93.44
94.70
LUPIN
713.20
(19.82)
8954750
31.05
0.00
0.56
88.99
91.26
PEL
1950.00
(15.88)
4250675
25.57
0.67
0.73
95.08
96.82
PFIZER
4217.50
(5.11)
123875
(42.18)
-1.75
1.22
95.11
92.99
STAR
314.30
(16.16)
4091400
(19.60)
1.33
0.60
93.91
94.85
SUNPHARMA
820.75
1.48
21898100
(18.62)
3.19
0.54
95.71
91.43
POWER
NTPC
124.15
(6.51)
36069600
(32.33)
-2.10
0.47
69.53
83.22
POWERGRID
191.15
(10.38)
25902381
(23.98)
0.27
0.73
81.78
89.58
TATAPOWER
204.30
(15.72)
110754000
(12.15)
0.00
0.77
95.12
95.22
REAL ESTATE
DLF
320.55
(14.72)
40971150
33.11
0.16
0.60
93.61
95.88
GODREJPROP
1452.90
(10.22)
5170425
38.76
1.22
0.54
96.26
95.93
TELECOM
BHARTIARTL
671.80
(5.26)
57734350
(3.12)
1.40
0.57
94.51
95.87
IDEA
9.75
(8.45)
686560000
(0.91)
10.81
0.44
85.78
76.24
INDUSTOWER
197.80
(20.69)
20846000
57.50
-41.51
0.56
95.03
91.75
TEXTILES
PAGEIND
40152.00
(1.65)
89610
13.53
-1.14
0.15
88.90
87.89

Derivatives Rollover Report
For Private Circulation Only
7
Technical and Derivatives Team:
Sameet Chavan Chief Analyst – Technical & Derivatives
Sneha Seth Derivatives Analyst
sneha.seth@angelone.in
Rajesh Bhosale Technical Analyst
rajesh.bhosle@angelone.in
Osho Krishan Senior Analyst – Technical & Derivatives osho.krishan@angelone.in
Research Team Tel: 022 – 39357600 (Extn. 6844) Website: www.angelone.in
DISCLAIMER
Angel One Limited (hereinafter referred to as “Angel”) is a registered Member of National Stock Exchange of India
Limited, Bombay Stock Exchange Limited and Metropolitan Stock Exchange Limited. It is also registered as a Depository
Participant with CDSL and Portfolio Manager and investment advisor with SEBI. It also has registration with AMFI as a
Mutual Fund Distributor. Angel One Limited is a registered entity with SEBI for Research Analyst in terms of SEBI (Research
Analyst) Regulations, 2014 vide registration number INH000000164. Angel or its associates has not been debarred/
suspended by SEBI or any other regulatory authority for accessing /dealing in securities Market.
This document is solely for the personal information of the recipient, and must not be singularly used as the basis of any
investment decision. Nothing in this document should be construed as investment or financial advice. Each recipient of this
document should make such investigations as they deem necessary to arrive at an independent evaluation of an
investment in the securities of the companies referred to in this document (including the merits and risks involved), and
should consult their own advisors to determine the merits and risks of such an investment.
Angel or its associates or research analyst or his relative may have actual/beneficial ownership of 1% or more in the
securities of the subject company at the end of the month immediately preceding the date of publication of the research
report. Neither Angel or its associates nor Research Analysts or his relative has any material conflict of interest at the time
of publication of research report.
Angel or its associates might have received any compensation from the companies mentioned in the report during the
period preceding twelve months from the date of this report for services in respect of managing or co-managing public
offerings, corporate finance, investment banking or merchant banking, brokerage services or other advisory service in a
merger or specific transaction in the normal course of business. Angel or its associates did not receive any compensation
or other benefits from the companies mentioned in the report or third party in connection with the research report.
Neither Angel nor its research analyst entity has been engaged in market making activity for the subject company.
Reports based on technical and derivative analysis center on studying charts of a stock's price movement, outstanding
positions and trading volume, as opposed to focusing on a company's fundamentals and, as such, may not match with a
